KiRAT - Kiel Real-time Application Toolkit
Structure of KiRAT
What is KiRAT?
Since 2010 the DSS-Group is developing KiRAT, this is an acronym that stands for Kiel Real-time Application Toolkit. Initially, it was made for audio and speech signal processing. Meanwhile, it also supports medical and underwater applications. The idea of KiRAT is to share common signal processing modules to benefit from each other. This enables a fast development, optimization, and evaluation of new real-time algorithms.
What is the structure of KiRAT?
KiRAT is a complex software and consists of several structures: algcore, algstruct, and exo. The core functionality of KiRAT includes a user interface that is specifically tailored to the application itself.
- Algcore: the core component responsible for signal processing algorithms, implemented in ANSI-C to ensure compatibility and seamless portability across different platforms;
- Algstruct: an overarching algorithmic structure that integrates a graphical user interface (GUI) with an algorithmic core and provides an intuitive environment for users to interact with KiRAT and visualize its outputs;
- Exo: “extra window” for the real-time control panel of KiRAT, specialized on the needs of users and independent of the common KiRAT style in the rest of the GUI;
What is the algorithmic core?
This part of KiRAT is the core component of KiRAT and responsible for signal processing algorithms.
- Implemented in ANSI-C to ensure compatibility and seamless portability across different platforms.
- Frequently used functions, such as vector operations and the Fast Fourier Transform (FFT), are accessed through an abstraction layer.
- This design enables the use of processor-specific optimized functions, enhancing efficiency and computational performance.
Basically, the algorithmic core is divided into four types of functions:
Init
The initialization function of a module is used to convert user parameters to internal parameters. It also allocates dynamic memory for internal signals and parameters. Input parameters and configurations are controlled by initialization files.
Process
The process function is called for every new frame. It consists of the actual processing of the algorithms.
Reset
There, the internal memory is reset, resulting in a defined state. Usually is executed when the program is restarted.
Deinit
Freeing memory in a module when the program gets closed.
KiRAT also supports low-latency multi-channel AD and DA conversion using the Port Audio Library and many other interfaces for external devices. One of the advantages of the algorithmic structure are abilities to measure impulse responses, record signals and parameters, and simulate various types of systems and environments in real time.
What is the algorithmic structure?
The algorithmic core is visualized and can be managed by an overarching algorithmic structure that integrates a graphical user interface (GUI).
- Developed in C++ using the Qt framework, ensuring a user-friendly and interactive experience.
- Provides an intuitive environment for users to interact with KiRAT and visualize its outputs.
- Enables users to start, stop, and pause KiRAT, as well as adjust various parameters.
- Supports signal plotting and feature visualization, allowing for a comprehensive analysis of extracted data.
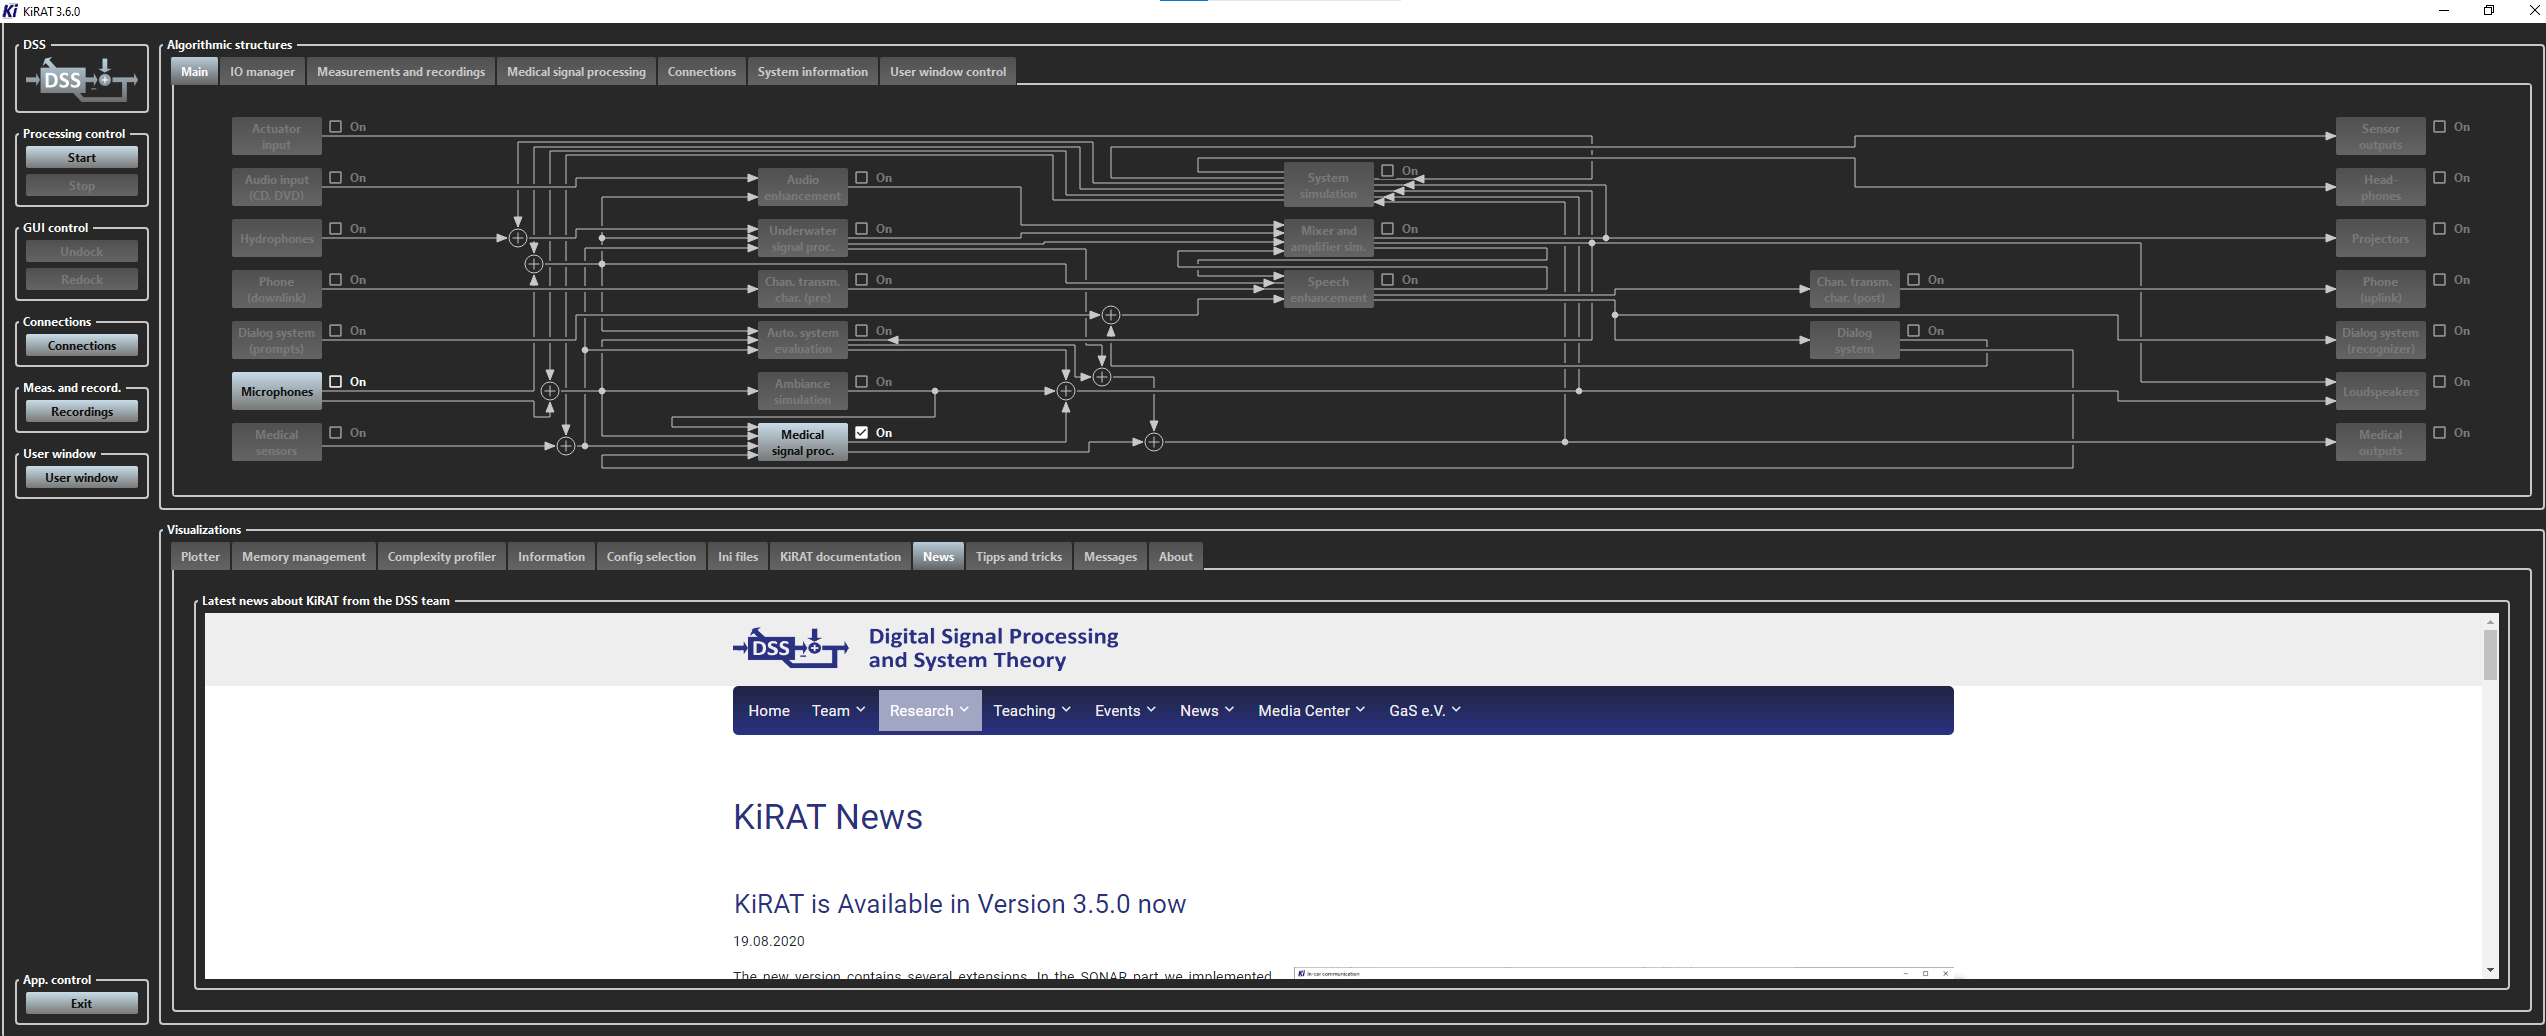
The main view of the KiRAT window.
- Algorithmic structures (top): the navigation between substructures of the system and access to other control parameters, connections between different modules, and illustration of how they are nested.
- Visualizations (bottom): monitoring tools, including a plotter for real-time signal and parameter visualization, information on the KiRAT memory consumption and CPU load, a configuration of the system, editing the configuration files, and information on the running processes in the system.
- Left column panel: quick access to the main functions of the framework, such as starting or stopping processing with the associated buttons.
The activated configuration at the figure's panel of “Algorithmic structures” is a simulation setup, where the “Microphone” as well as the “Medical signal processing” are activated. The input from the microphone is processed in the connected structure of the “Medical signal processing”.
What is the Exo?
The Exo stands for the "extra window" for the real-time control panel of Kirat. It is the one of structures of KiRAT and it is responsible for the graphical user interface (GUI) of KiRAT. A custom GUI window is created and specialized to the user's needs and independent of the common KiRAT style in the rest of the GUI. Users are allowed to interact with KiRAT and visualize its output via exo.
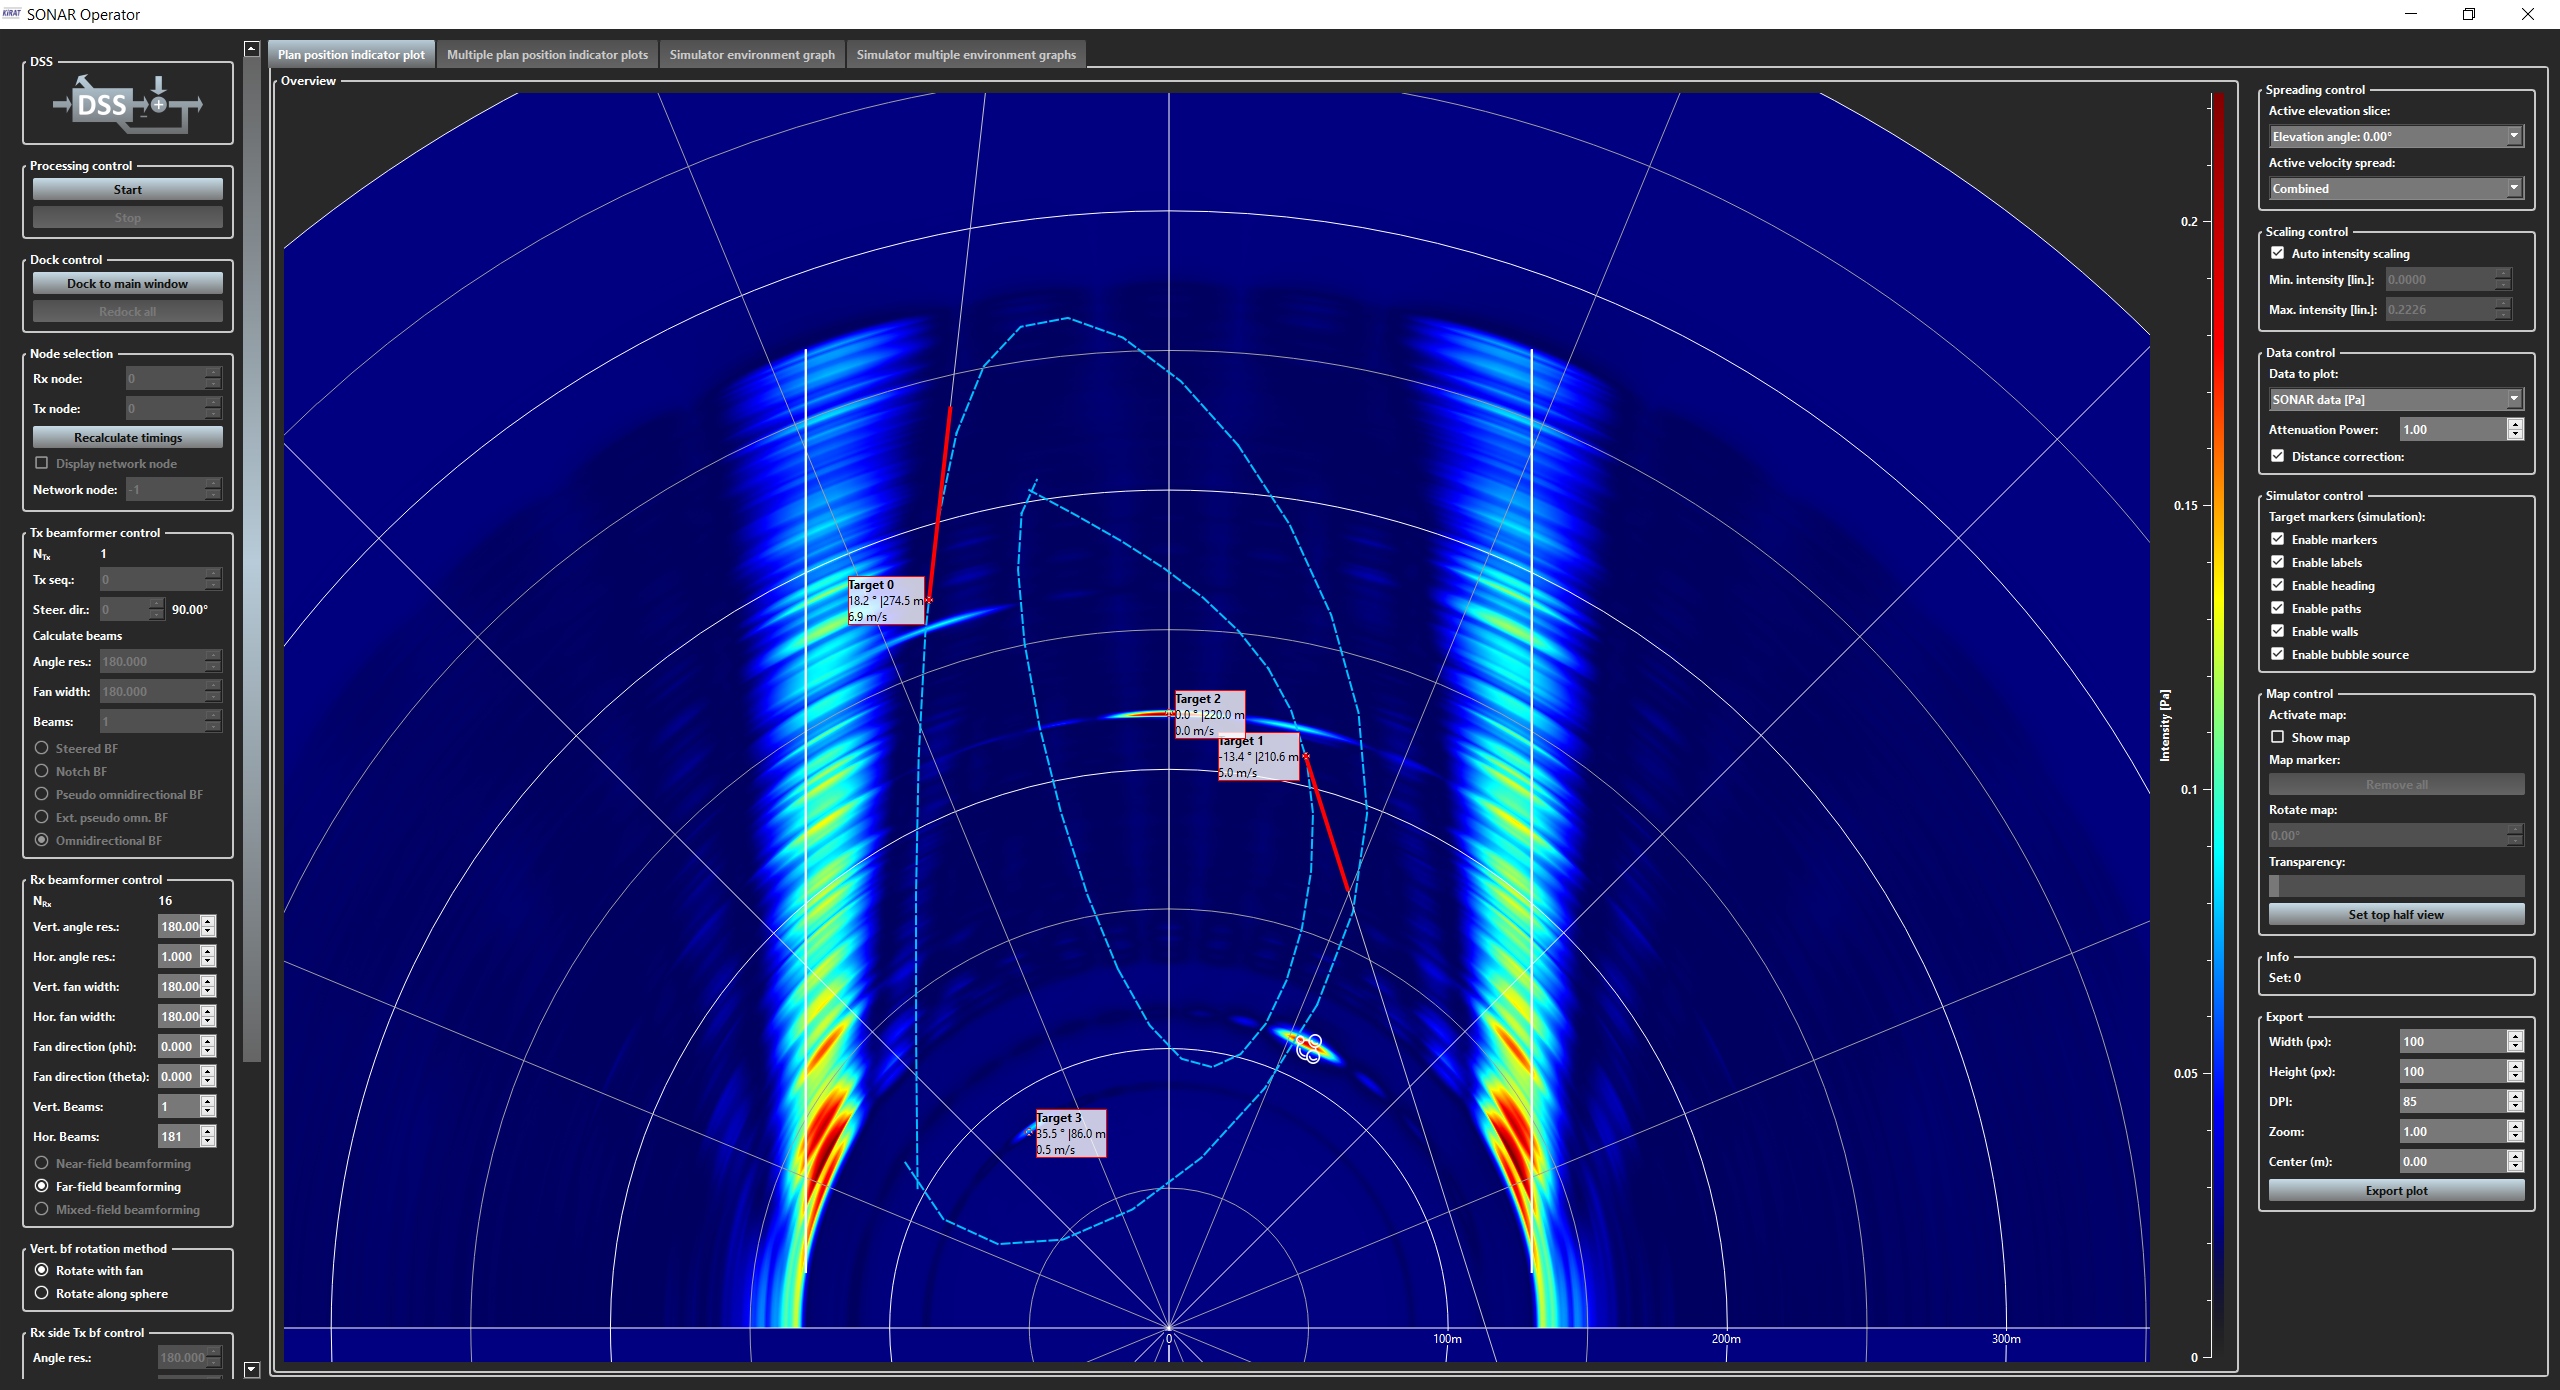
The GUI of the SONAR operator with the demo configuration of the digital ocean.
Users can use the exo to start, stop, and pause KiRAT, as well as to adjust various parameters. Also, the exo can be used to plot various signals or features that are extracted by KiRAT.
What is a CSV file?
A comma-separated values (CSV) file is a plain text file that stores tabular data in a simplified format. It uses commas to separate data fields and newlines to separate records. CSV files are often used to exchange data between different applications because they are simple and easy to read.
How to read a CSV file?
A possible way to open a CSV file is to use a text editor like Notepad or TextEdit. However, text editors are not designed to work with tabular data, so they may not display the data in a very user-friendly way.
Opening the CSV file in Excel is a much better option. It will display the data in a clear and organized way, and it will make it easy to work with the data. Additionally, Excel can automatically detect the delimiter that is used in the CSV file, and it can also handle CSV files that have a header reo. To ensure that the data is displayed correctly and that you can easily work with it.
Follow the following steps to open the file in Excel:
-
Open Excel.
-
Click the Data tab.
-
In the Get external data group, click from Text/CSV.
-
In the Import data dialog window, locate the CSV file you want to open, and click Import.
-
In the text import wizard dialog box, make sure that the delimited option is selected, and then click Next.
-
In the delimiters step, select the Comma checkbox, and then click Next.
-
In the data format step, make sure that the general option is selected for all of the columns, and then click Finish.
The CSV file will be imported into a new Excel worksheet. You can then work with the data as you would with any other Excel data.
What is possible to output as a CSV file with KiRAT?
With KiRAT you can output a variety of data as CSV files, including:
- Extracted features
- Patient data
- Survey responses
It is important to notice that the ability to output data as CSV files has to be implemented directly in the code (for features) and is dependent on the specific application. Input data can be recorded directly via a recordings tool.
How to configure a survey?
Surveys
Surveys are divided into two sections. On the one hand, welcome pages can be defined which are shown before the actual tests start. These can request answers for the user. Subsequent queries are implemented as actual survey options as patient survey. Both variants are configured similarly.The following parameters can be adjusted in the corresponding area of the config: First you have to specify whether the respective section is to be used and how many questions belong in the corresponding section.
| bEnableWelcomePages | = | true |
| iNumWelcomePages | = | 39 |
% Patient survey
%---------------------------------------------------------
| bSurveyenabled | = | true |
| iNumofQuestions | = | 0 |
The following configuration options are only shown on the basis of the welcome pages. The same options are available for the general patient survey. Each question can be displayed and linked with the help of an HTML page:
cHtmlLinkWelcome_0 = "C:/dss_kirat_config/objective_speech_analysis/patient_survey/html/welcome.html"
cHtmlKeywordWelcome_0 = "Nutzung Stimme"
bWelcomePageAnswerNeeded_0 = false
Answers
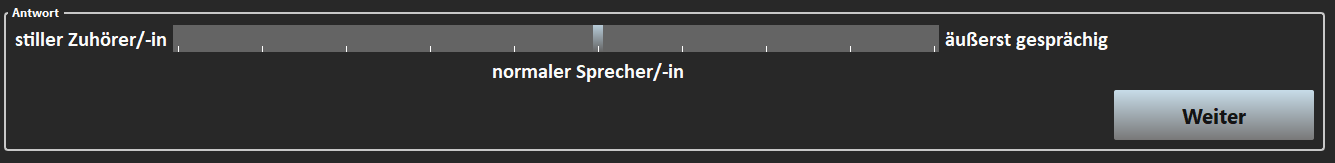
If an answer is required, the parameter is set to true and there are three different options in which responses are possible:- Answer with a slider. The slider can be defined in the config and is displayed in the Exo as defined:
eQuestionTypeWelcome_4 = 0
% (0: slider, 1: single (1 of N), 2: multiple (m of n), 3: info to confirm)
%--- Slider settgings: 4cSliderLabelLeftWelcome_4 = "still"
cSliderLabelRightWelcome_4 = "äußerst gesprächig"
iSliderMinimumWelcome_4 = 1
iSliderMaximumWelcome_4 = 10
bSliderTickEnabledWelcome_4 = true
iSliderTickIntervalWelcome_4 = 1
iSliderNumOfAdditionalLabelsWelcome_4 = 1
iSliderPositionOfAdditionalLabelsWelcome_0_0 = 6
cSliderAdditionalLabelsWelcome_0_0 = "normal"
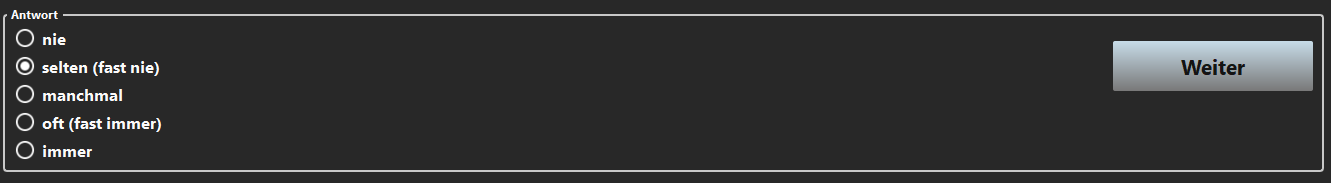
- One answer is possible. The number of answers and the answer options are adjusted and displayed.
eQuestionTypeWelcome_5 = 1
% (0: slider, 1: single (1 of N), 2: multiple (m of n), 3: info to confirm)
%--- One of N answers settings: 5
iNumOfAnswersOneOfNWelcome_5 = 5
cAnswerOneOfNWelcome_5_0 = "nie"
cAnswerOneOfNWelcome_5_1 = "selten (fast nie)"
cAnswerOneOfNWelcome_5_2 = "manchmal"
cAnswerOneOfNWelcome_5_3 = "oft (fast immer)"
cAnswerOneOfNWelcome_5_4 = "immer"
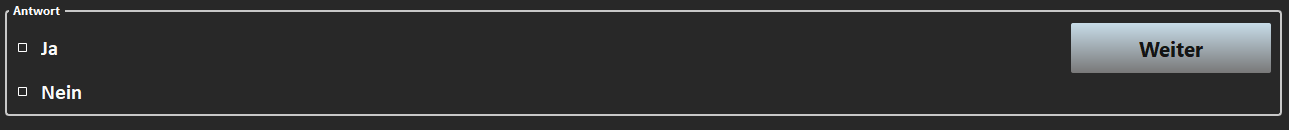
- Multiple answers are possible.
eQuestionTypeWelcome_1 = 2
% (0: slider, 1: single (1 of N), 2: multiple (m of n), 3: info to confirm)
%--- Multiple-answer settings: 1
iNumOfAnswersWelcome_1 = 2
cAnswerWelcome_0_0 = "Ja"
cAnswerWelcome_0_1 = "Nein"
What is a report?
Visualizations: Plotter
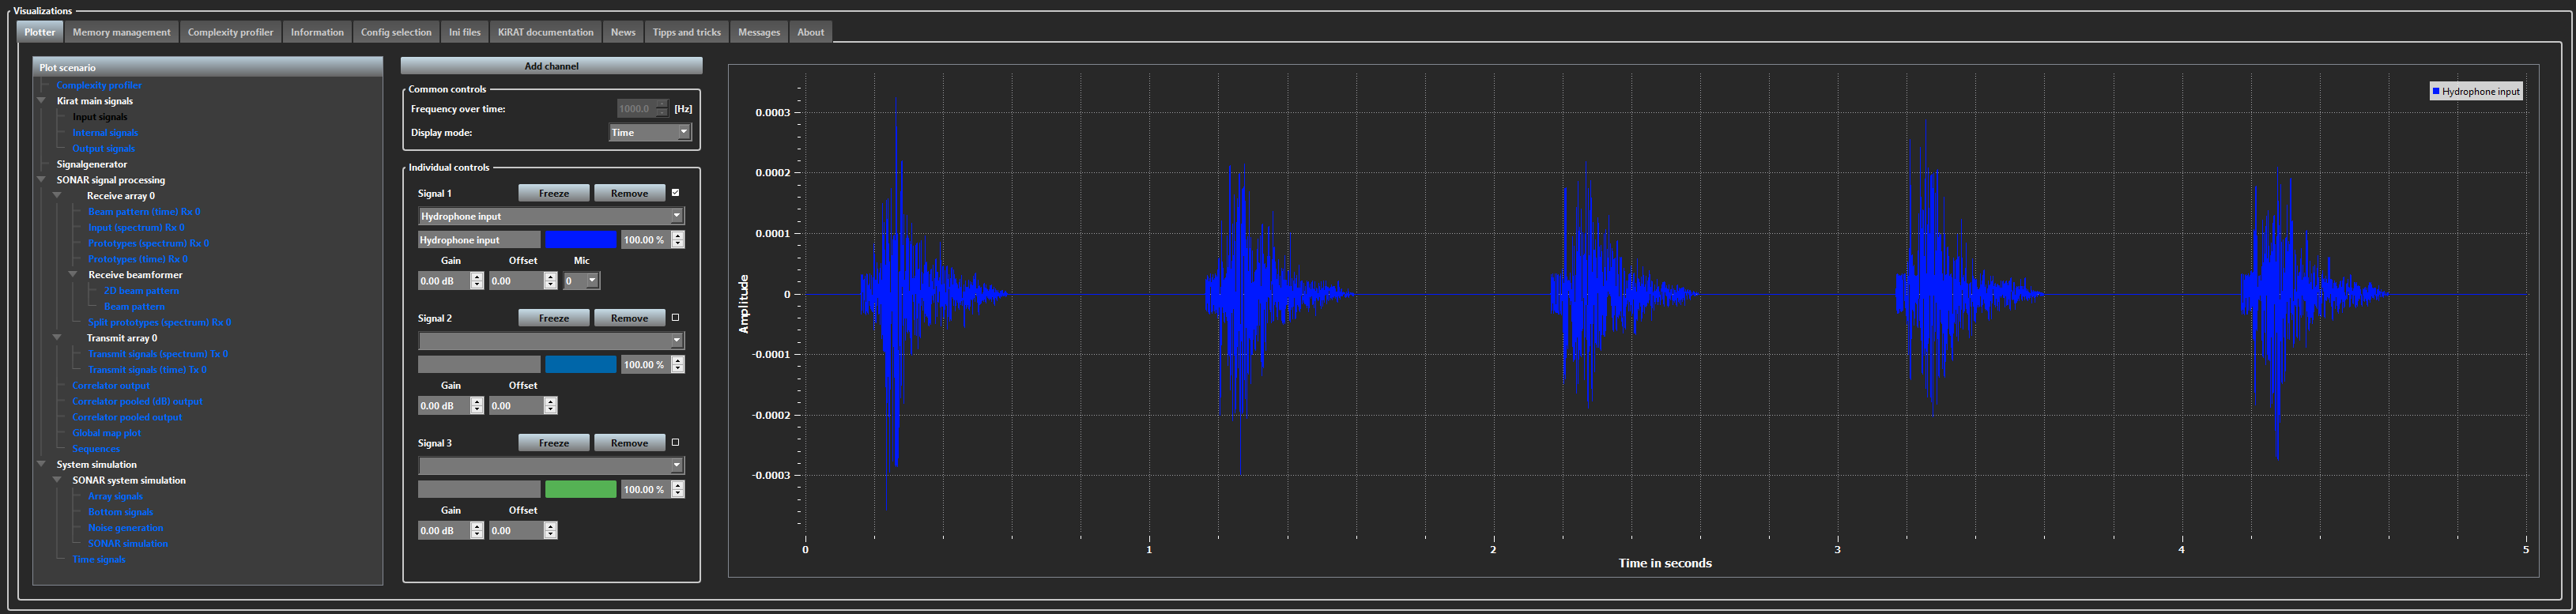
The view of the "Plotter".
The “Plotter” tab is a part of Visualizations control panel and shows a plot of the running signals. The signal is chosen from the drop-list “Plot scenario” on the left (separated into sections “Kirat main signals”, “SONAR signal processing”, and “System simulation” etc.). A time or frequency domain can be used to see the result. Also, several signals can be added to the same plot.
For example, this plot shows the hydrophone 0 input signal in the time domain, which was chosen from the “Kirat main signals” – “Input signals”.
How to autoscale the plot?
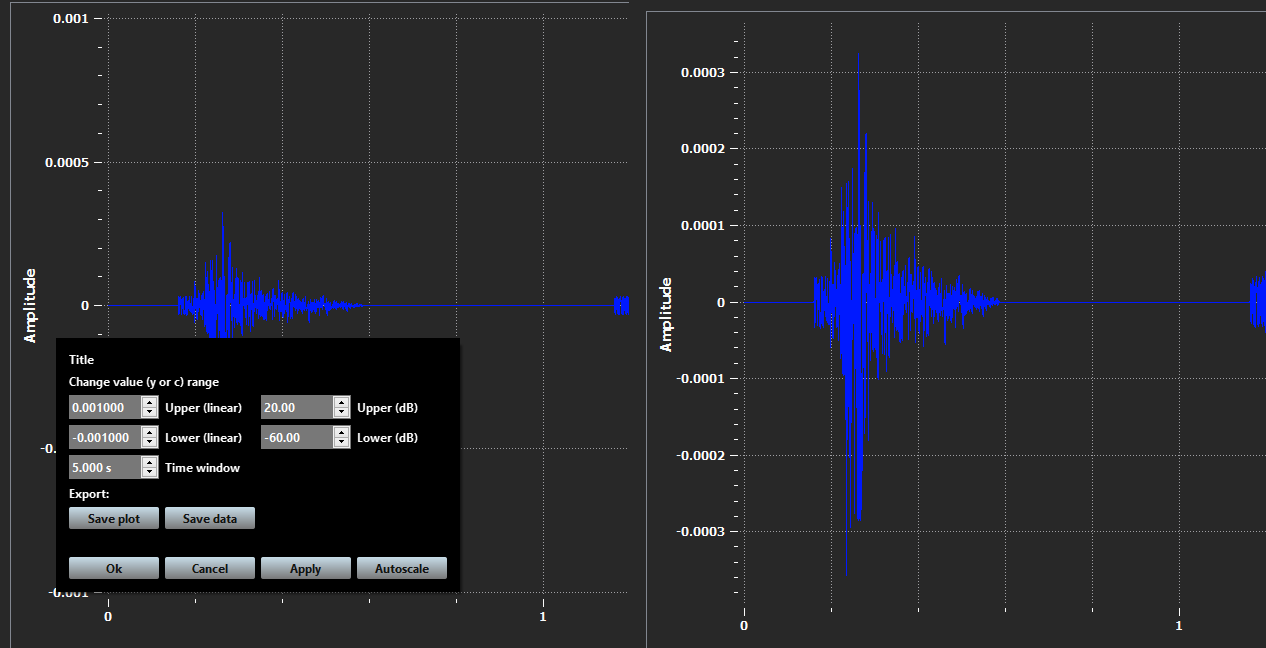
The view of the double-click for autoscale-function in the "Plotter" and the result of it applied to the plot.
By double-clicking with the left mouse button on the plot with a signal, a small window appears. Axis values of the plot (in linear or dB scale) can be modified here, by specifying their range. The outcome data can be exported as a plot or Matlab data.
There are at the bottom buttons “Ok”, “Cancel”, “Apply”, and “Autoscale” buttons. Those stand for closing the window, canceling the changes, saving the changed data, and applying changes, as well as autoscaling the plot.
Visualizations: Memory management
“Memory management” tab is located in Visualizations control panel. There it shows how much memory individual modules of the software are allocating. It depicts the percentage of the used memory related to each part, their local memory, overhead, maximum total memory, and a stack size initialization.
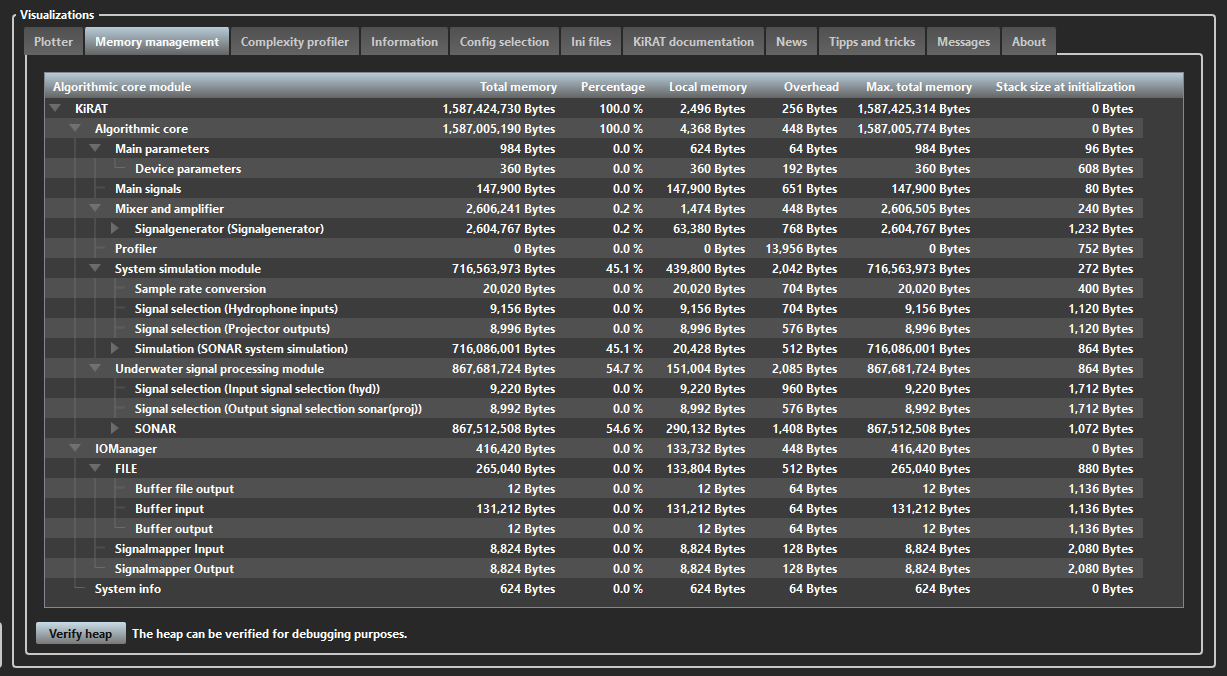
The view of the "Memory management".
Visualizations: Complexity profiler
“Complexity profiler” represents the running time-cost of each module, their average, minimum, and maximum performance, CPU load, and the thread used for running. The tab is located in Visualizations control panel. On the right side the plot of the average and running time of the simulation. The double click is also available to change axis range values for this plot. For example, the following plot illustrates the average and the running time of processing the “Underwater signal processing module” in μs.
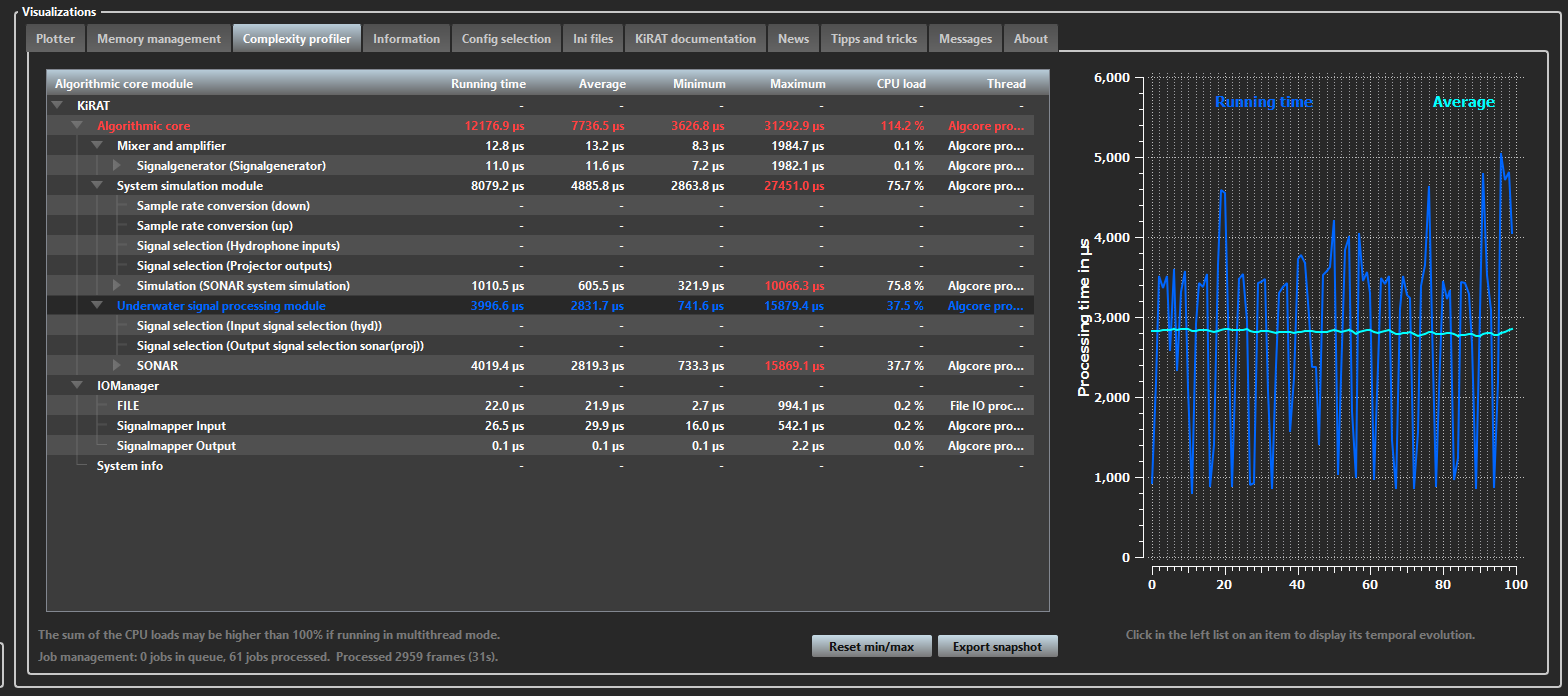
The view of the "Complexity profiler".
Visualizations: Information
“Information” provides a description of each module displayed in the Algorithmic Structures control panel. The tab is located within the Visualizations control panel and allows users to view detailed module descriptions in a scrollable interface.
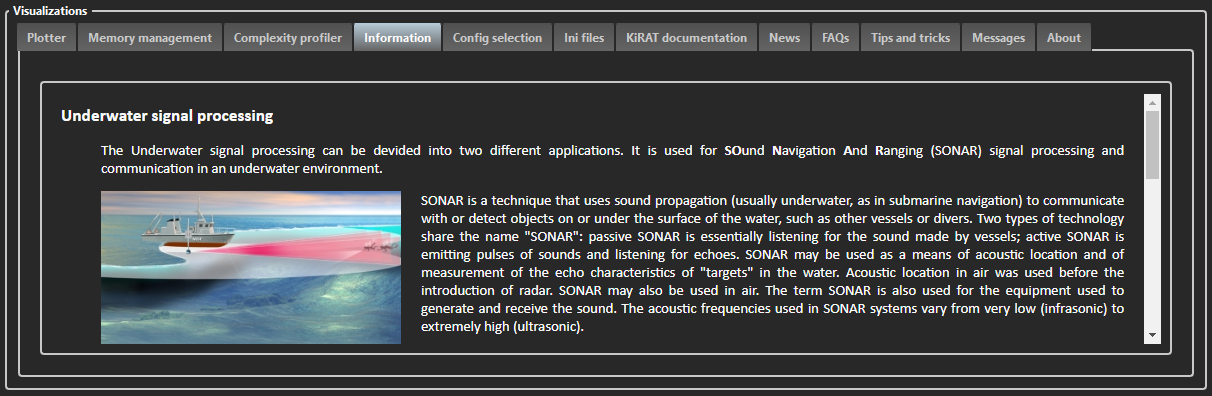
The view of the "Information".
Visualizations: Config selection
“Config Selection” represents the list of paths to configuration files used by KiRAT for a specified task. The tab is located in the Visualizations control panel. It allows users to browse for the necessary configuration directory address and access previously used configurations. When a new configuration path is selected, the "Update Config" button must be pressed in the right bottom corner to update the new path in the configuration file of the KiRAT “main.kcf”. Afterward, the program must be restarted with “Restart KiRAT” button for the changes to take effect and function correctly.
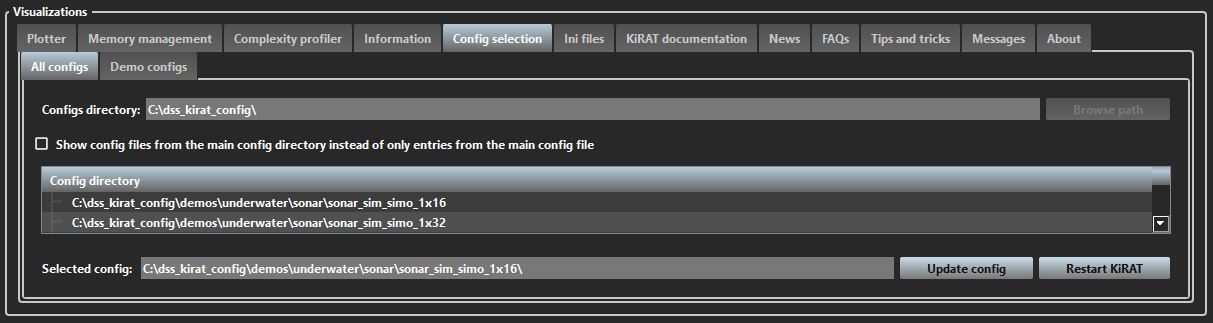
The view of the "Config selection".
The subtab “Demo configs” shows the description of available demo versions of KiRAT- scenarios. The “Further information” button leads to the website with its extended descriptions. This tab outputs the information about each chosen module in the upper panel Algorithmic structures.
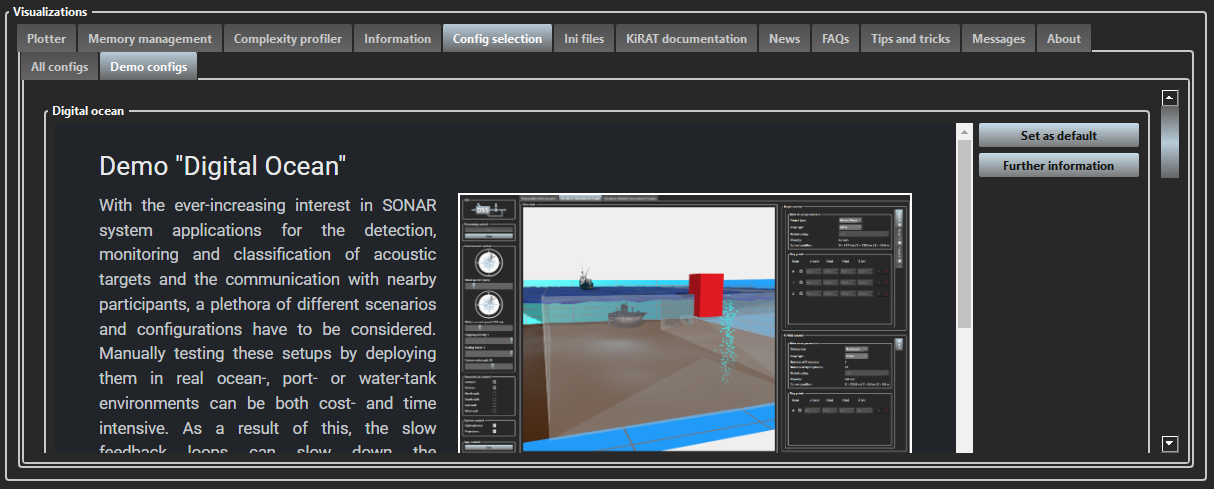
The view of the demos infotab in the "Config selection" panel.
Visualizations: Ini files
“Ini Files” provides access to configuration files. Input values for the program can be modified and saved to the existing configuration directory within this tab. The some of existing parameters are booleans and can be assigned with true or false values. Located in the Visualizations control panel, the tab allows users to view detailed module descriptions in a scrollable interface.
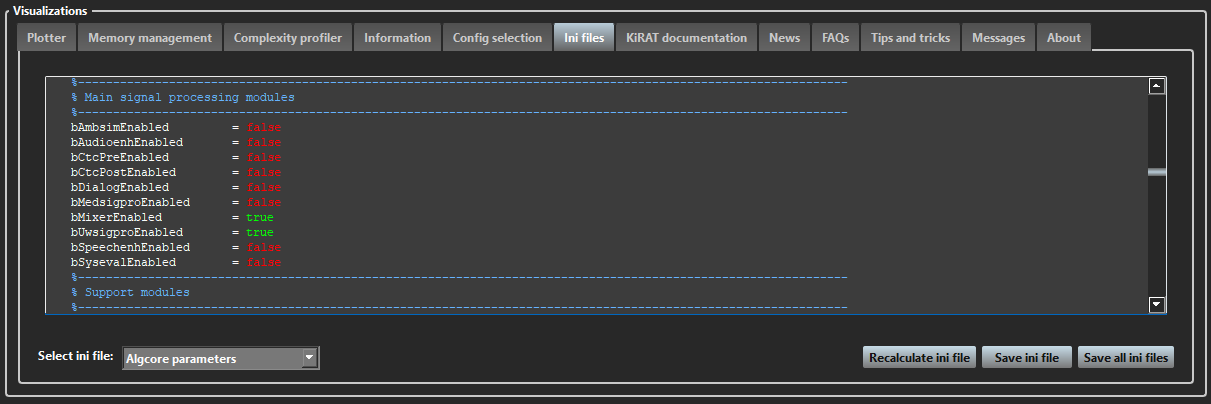
The view of the "Ini files".
In the bottom left corner, the drop-list contains a set of files (note: this is a list of the ini files for the underwater demo):
- GUI settings: activation of profiler visualization, fade-in effect, show or hide main window, menu, splash screen settings, layout, style file; GUI of the algorithmic part, visualization part, plots, shortcuts;
- GUI splashscreen: enabling the information window, its pictures styling, and paths;
- System information: CPU, memory, screen requirements;
- IO configuration: the choice of signals, input-output settings, enabling asynchronous IOs, and file types;
- Algcore parameters: activation of signal processing activity on start-up, framework parameters, signal processing modules, support modules, and channel settings;
- Device parameters: parameters for the audio simulation in the car;
- Mixer module: activation of mixer module, the IO channels and their combinations, signal generator;
- Underwater signal processing (uwsigpro): enabling of uwsigpro module, enabling individual modules, submodules: setting signal selection parameters;
- Sonar: activation of individual SONAR modules, setting general SONAR parameters (ping, plot, node);
- Receive & Transmit array: activation of arrays, input stream delay, array setup;
- Pings: sequence parameters;
- System simulation: activation of the syssim module, simulation of SONAR signals, settings for digital ocean objects, e.g. hardware dry-to-wet and wet-to-dry, sea surface and bottom, noise generation, channel simulation, underwater objects: target, target group, array, point cloud, bubbles, volume, wall, way simulation;
- Resource management: enabling the module, and heap corruption detection settings;
- KiRAT main settings: configuration path, job management, and multithreading, path settings;
- Measurements and recordings: enabling measurements, and recording settings;
- Exo module: enabling execution module submodules, defining SONAR operator parameters;
- Plotter settings: plotting title, line style, current scenario, plot settings;
- Config selector: settings of the demos config selector;
Visualizations: KiRAT documentation
“KiRAT Documentation” provides direct access to the official kirat.de webpage, which provides a general introduction to the software. The tab is located in the Visualizations control panel and enables users to seamlessly browse reference materials without leaving the application interface.
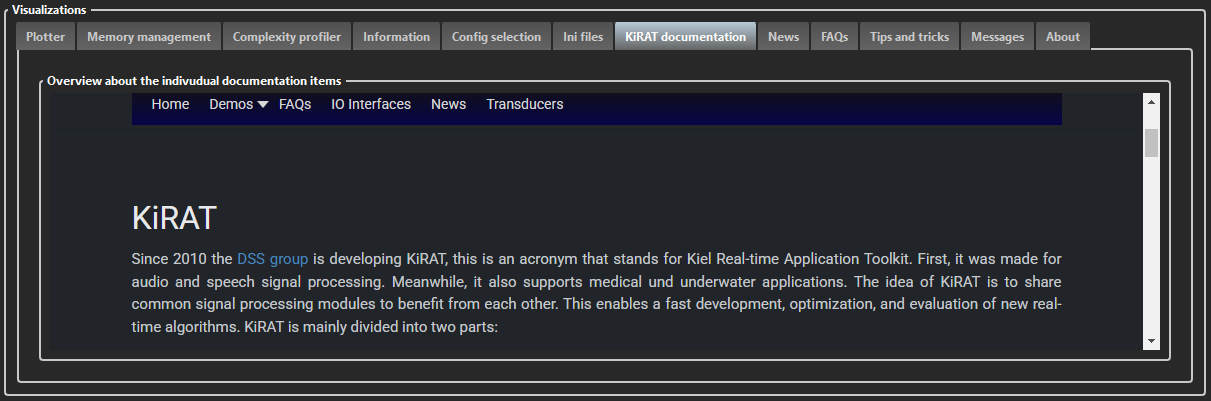
The view of the "KiRAT documentation".
Visualizations: FAQs
“FAQs” shows the kirat.de websiite page with FAQ section activated. It hosts comprehensive descriptions, usage guides, and troubleshooting resources. The tab is located in the Visualizations control panel and enables users to seamlessly browse reference materials without leaving the application interface.
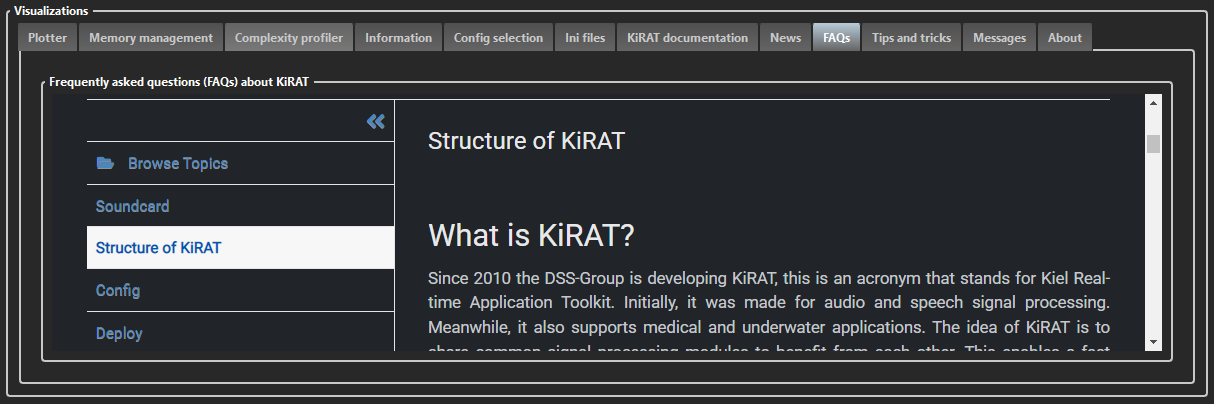
The view of the "FAQs".
Visualizations: Tips and tricks
“Tips and Tricks” provides direct access to the dss-kiel.de website, which offers practical advice, shortcuts, and best practices for using the KiRAT software efficiently. The tab is located in the Visualizations control panel and allows users to explore the website without exiting the application.
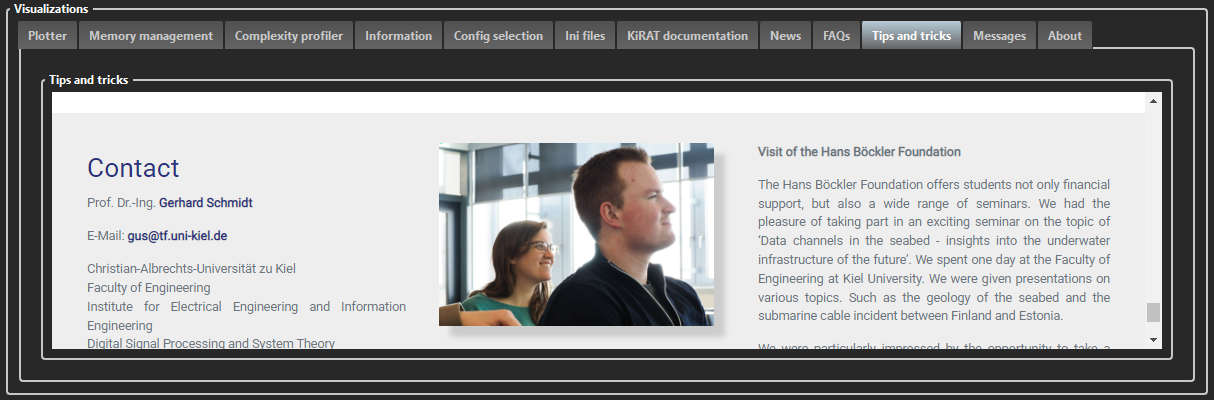
The view of the "Tips and tricks".
Visualizations: Messages
“Messages” displays real-time prompts and notifications related to the status of executed processes within the software, enabling users to track informational updates, warnings, and error messages. Different filters can be applied in the right bottom corner to see only a specific type of message. In this case, debug, info, or warnings can be chosen. The tab is located in the Visualizations control panel and provides a chronologically organized, filterable log for streamlined debugging and monitoring.
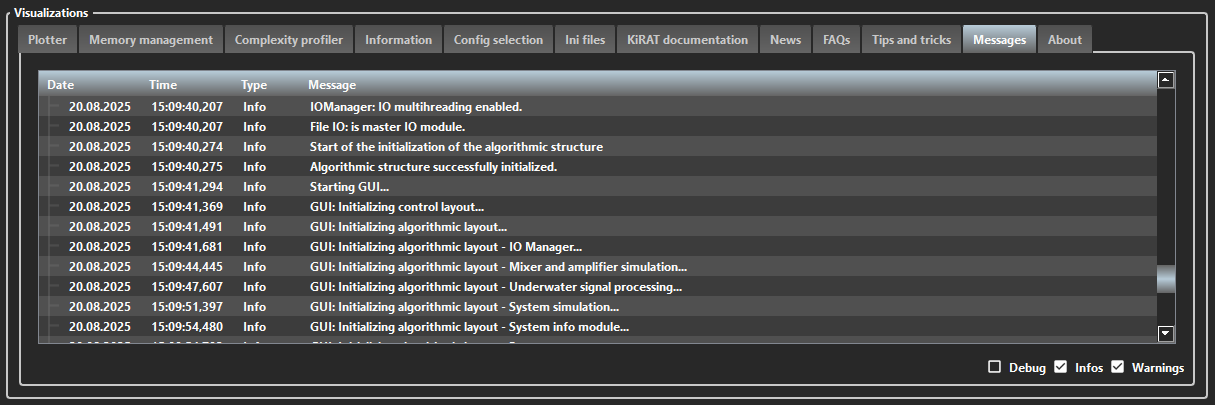
The view of the "Messages".
Visualizations: News
“News” provides direct access to the kirat.de website, where users can view the latest updates, feature announcements, and development news related to KiRAT. The tab is located in the Visualizations control panel and ensures users stay informed about software enhancements without leaving the application environment.

The view of the "News".
Contact
Prof. Dr.-Ing. Gerhard Schmidt
E-Mail: gus@tf.uni-kiel.de
Christian-Albrechts-Universität zu Kiel
Faculty of Engineering
Institute for Electrical Engineering and Information Engineering
Digital Signal Processing and System Theory
Kaiserstr. 2
24143 Kiel, Germany
% Welcome Page
%---------------------------------------------------------