Movement Analysis
This demo presents an automated approach to classifying various types of human activity. The motions considered include sitting, standing, sitting down, standing up, walking, brushing teeth, and picking up an object from the ground.
The concept behind this classification is to collect data from multiple inertial measurement units (IMUs) and process it to determine the current activity. IMUs are small, relatively inexpensive sensor packages that combine accelerometers and gyroscopes along multiple axes. This enables the tracking of both linear and angular motion.
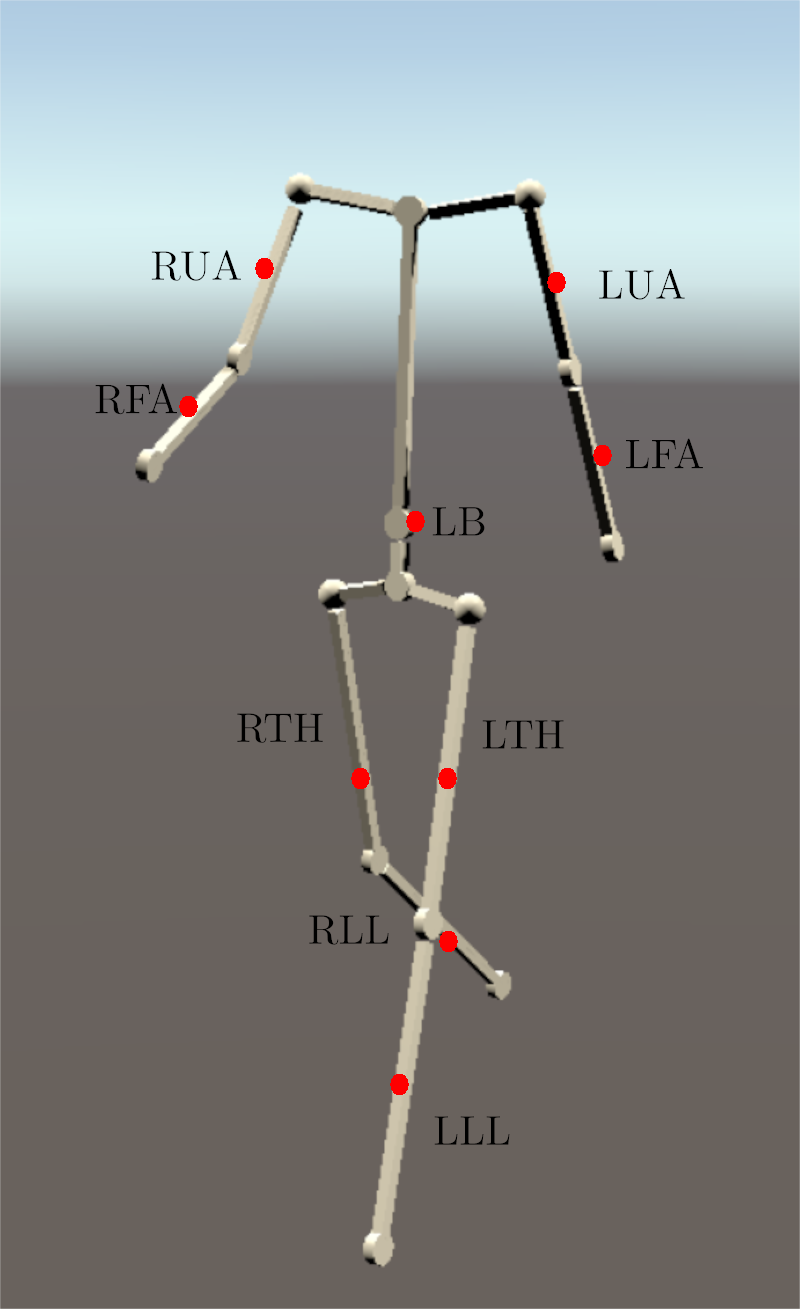
Schematic of the placement of the used sensors with short handles for the respective body parts.
Data collected from the relevant activities using nine IMUs — positioned as illustrated in the schematic above — was used to develop the implemented signal processing chain. This processing chain is visible in the main window of KiRAT under Medical signal processing → Motion signal processing → Movement classification, and is shown in the screenshot below.
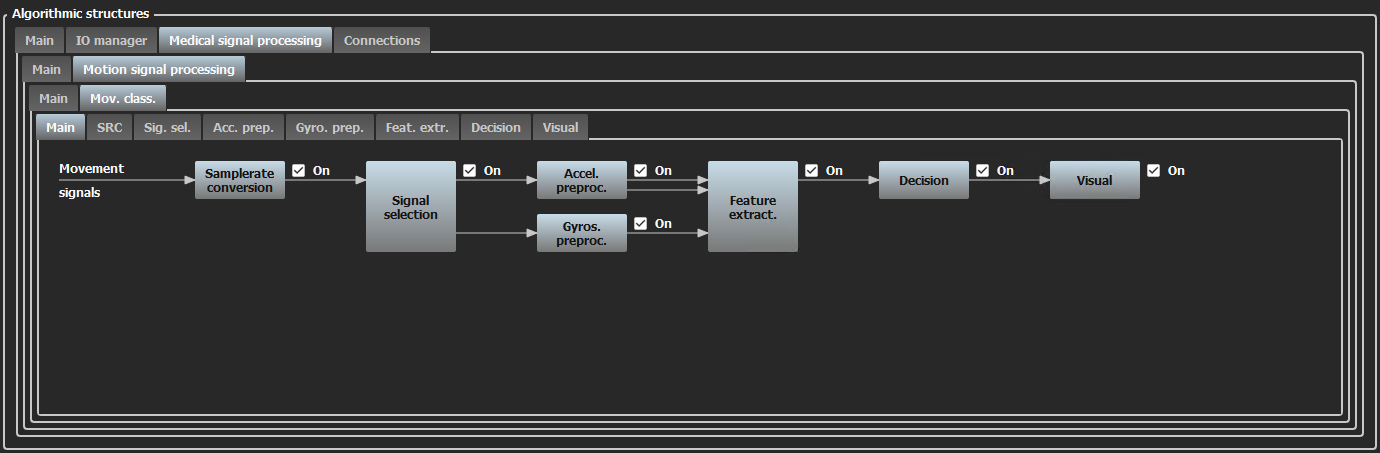
Screenshot of the signal processing chain in KiRAT.
Sample rate conversion is only required for live sensor data and is therefore inactive in this demo. The signal selection step then separates the data into accelerometer and gyroscope channels, which are subsequently preprocessed. During preprocessing, filtering is applied to denoise the sensor data (via low-pass filtering) and to remove constant components in the accelerometer data caused by gravity. The corresponding filter parameters can be examined by clicking on the relevant blocks within the preprocessing modules.
Most of the processing occurs within the subsequent feature extraction block, which has a more complex structure. This structure is illustrated in the following screenshot, once again taken from the main KiRAT window.
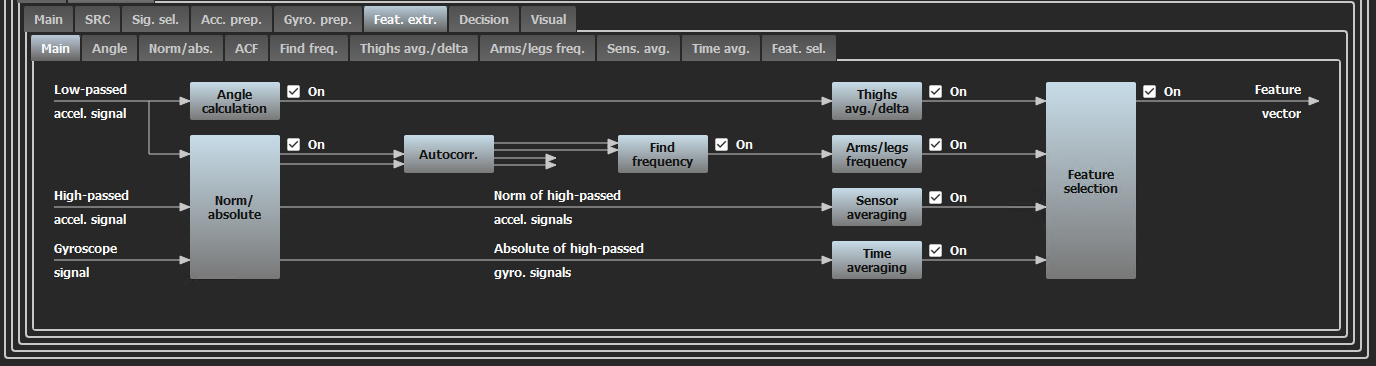
Screenshot of the feature extraction signal processing chain in KiRAT.
To begin with, the angles between the sensor packages and the ground are calculated, and both the vector norms and absolute values of the signals are computed. The vector norms are then used to estimate the autocorrelation of the measured motion signals, which later aids in identifying periodic patterns in the movements.
All of this is then used to extract numerical features in a frame-based, real-time manner. These features include estimated movement frequencies of the arms and legs, the average angle between the thighs and the ground, and short-term variations in that angle. Additionally, the vector-normed, high-pass filtered accelerometer signals are used to quantify overall activity levels. Time-averaged gyroscope signals provide a measure of lower back bending, which helps to identify the picking-up activity.
Currently, only a small subset of the calculated feature values is used for decision-making, which are selected by the feature selection block. This block allows for flexibility in choosing which features to use, depending on the decision method applied — especially once multiple algorithms are implemented.
The current decision method is a classification tree, which splits based on feature values selected through empirical analysis of the recorded data. A visual representation of the implemented tree is shown below.
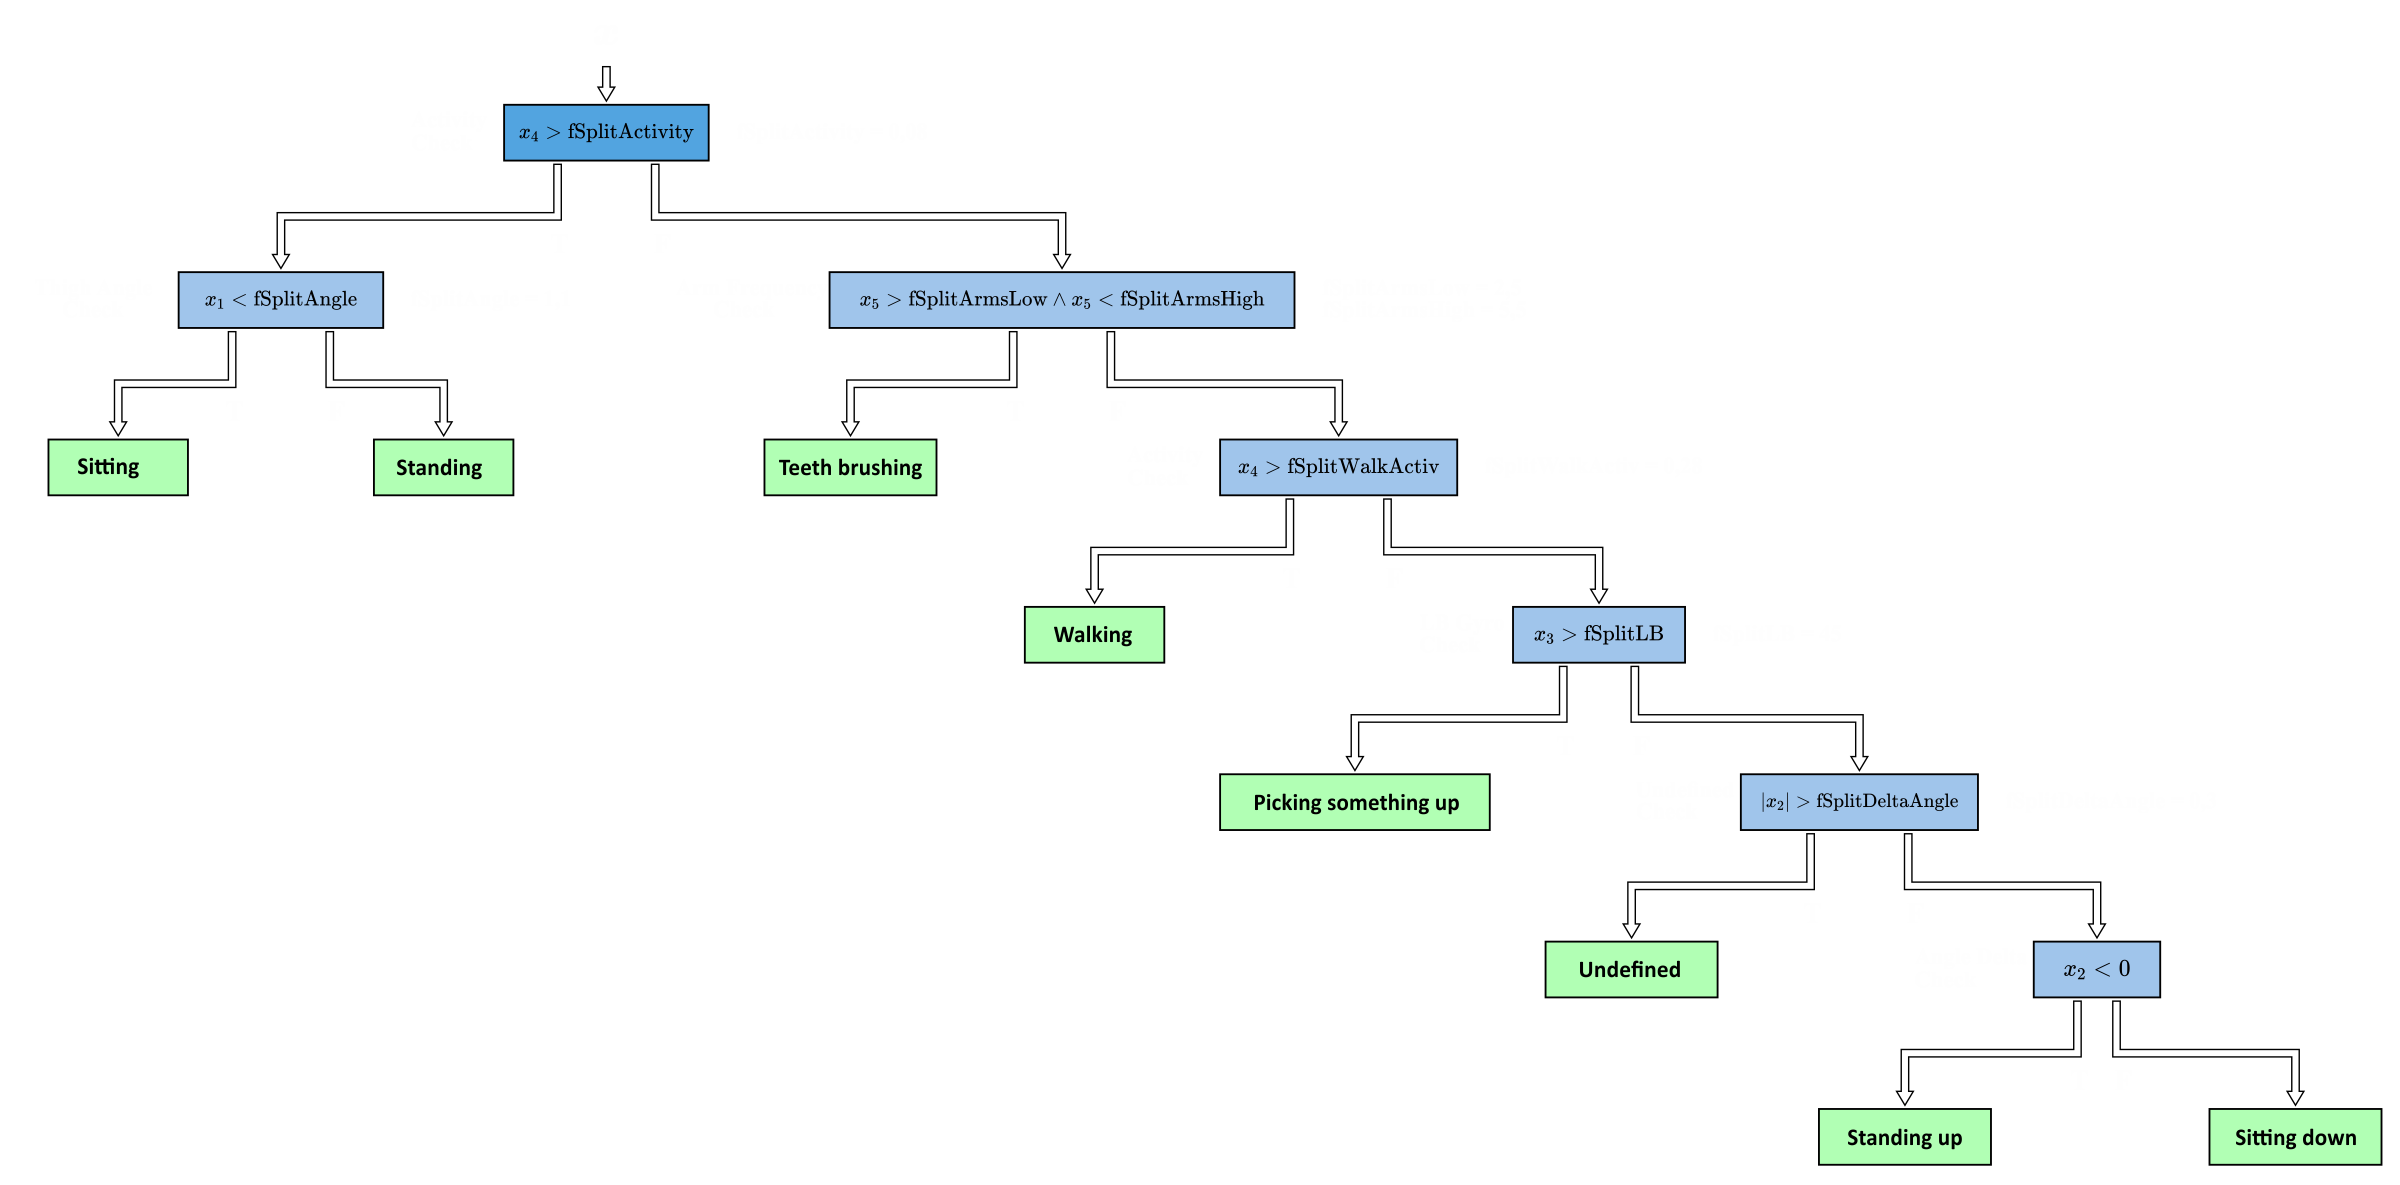
Decision tree implemented in the movement classification KiRAT demo.
When processing is initiated in KiRAT (by pressing the Start button in the upper-left corner of the main window), a short motion recording is replayed from a file, simulating live sensor input. The recording begins with sitting, standing up, and standing, followed by a picking-up motion. This is succeeded by a period of teeth brushing and walking, and concludes with a sitting-down motion that returns to a seated position. The cycle repeats continuously until the Stop button is pressed in KiRAT. During processing, the decision is displayed in the block labeled Visual in the main window. Colored blocks in the plot indicate which activity is currently identified by the decision tree, as shown above.
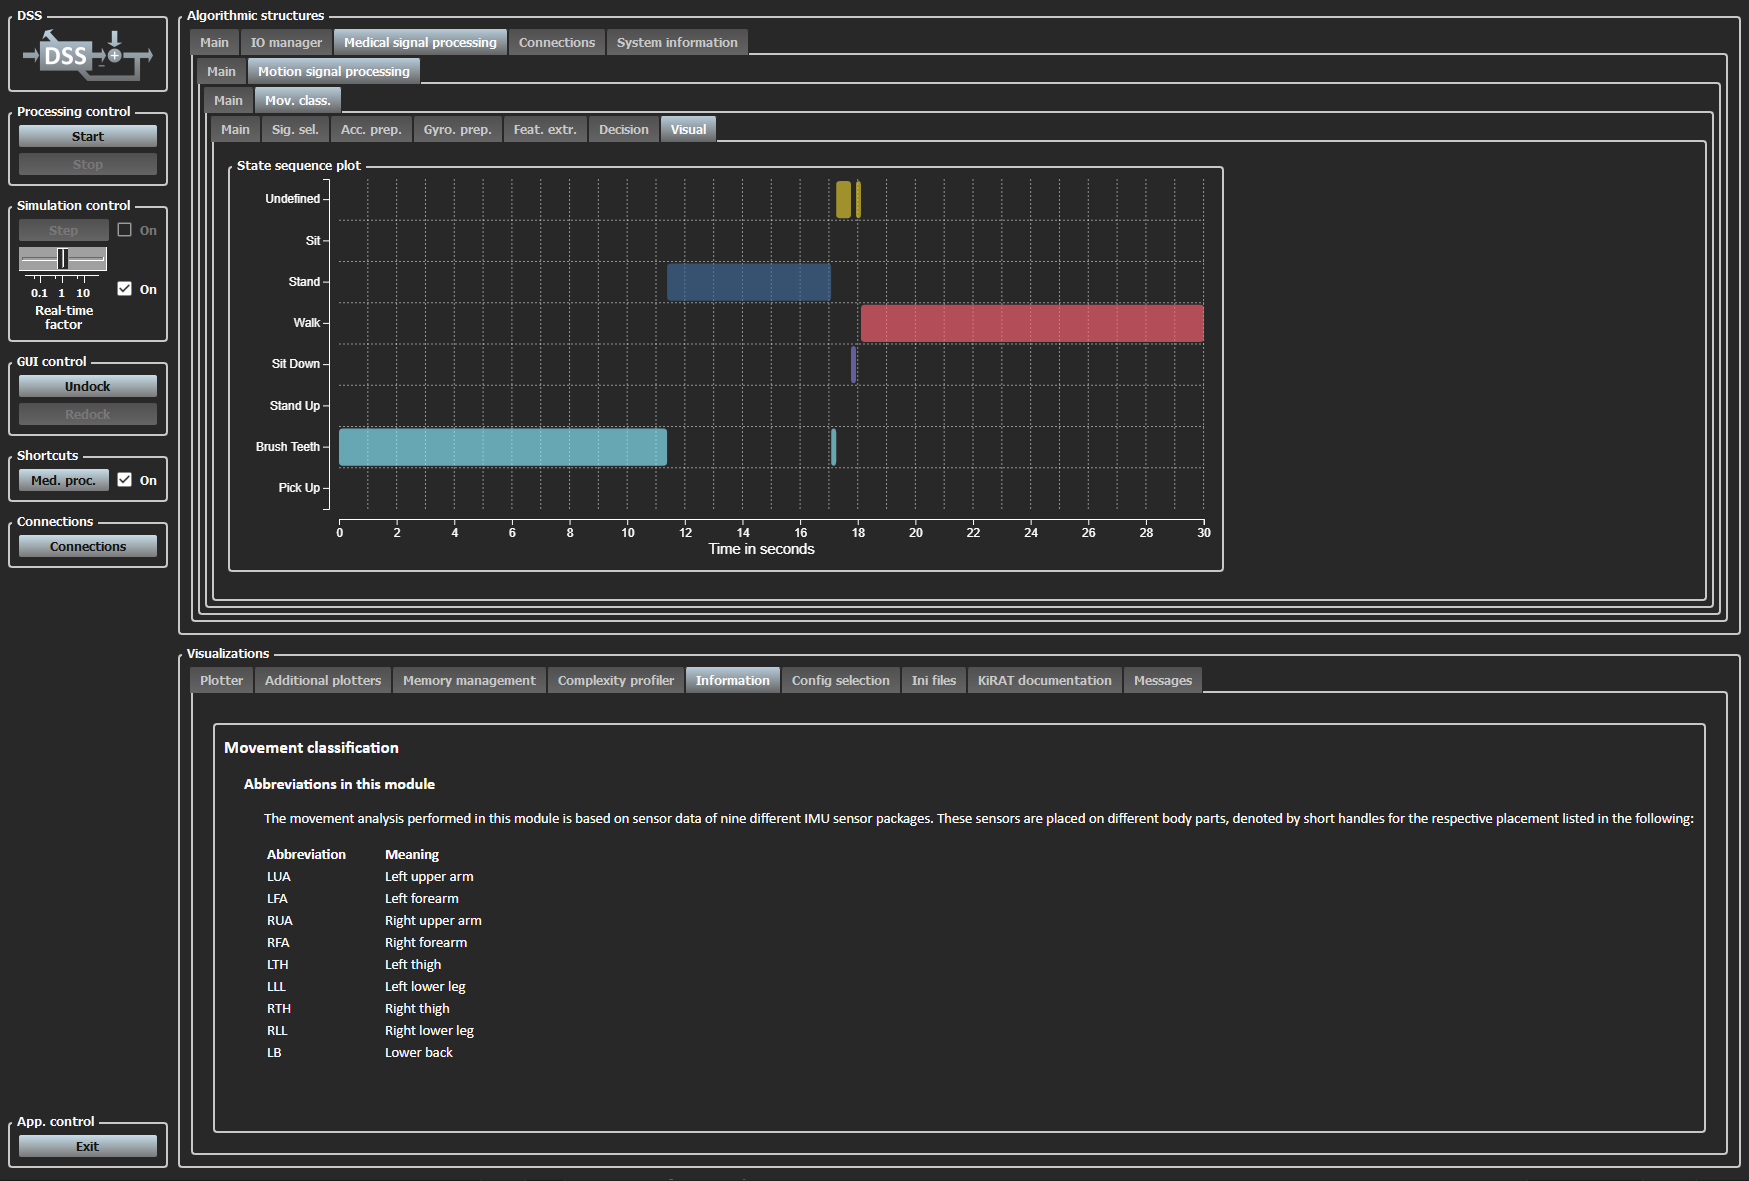
Screenshot of of the visualization of the decision.
At the same time, the additional window shows several different plots of the estimations the autocorrelation of the vectornormed accelerometer signals of the different IMUs. For each sensor package, there are three different plots:
- One plot with the regular (biased) autocorrelation and an unbiased version of that.
- Another plot in which the autocorrelations are normalized in a way that the correlation at 0 lag is exactly 1.
- A third plot of the autocorrelation over time in a colormapped representation.
All of these are especially helpful for the real-time evaluation of present input by a user. The periodicity with higher frequency of the brushing teeth motion is especially apparent in these plots. A periodicity of both arm and leg swing during walking can also be seen, though this is not as pronounced which is due to the short distances walked for the recording. Other movement also leads to apparent activity in the plots but lacks the line characteristics of periodic motions.
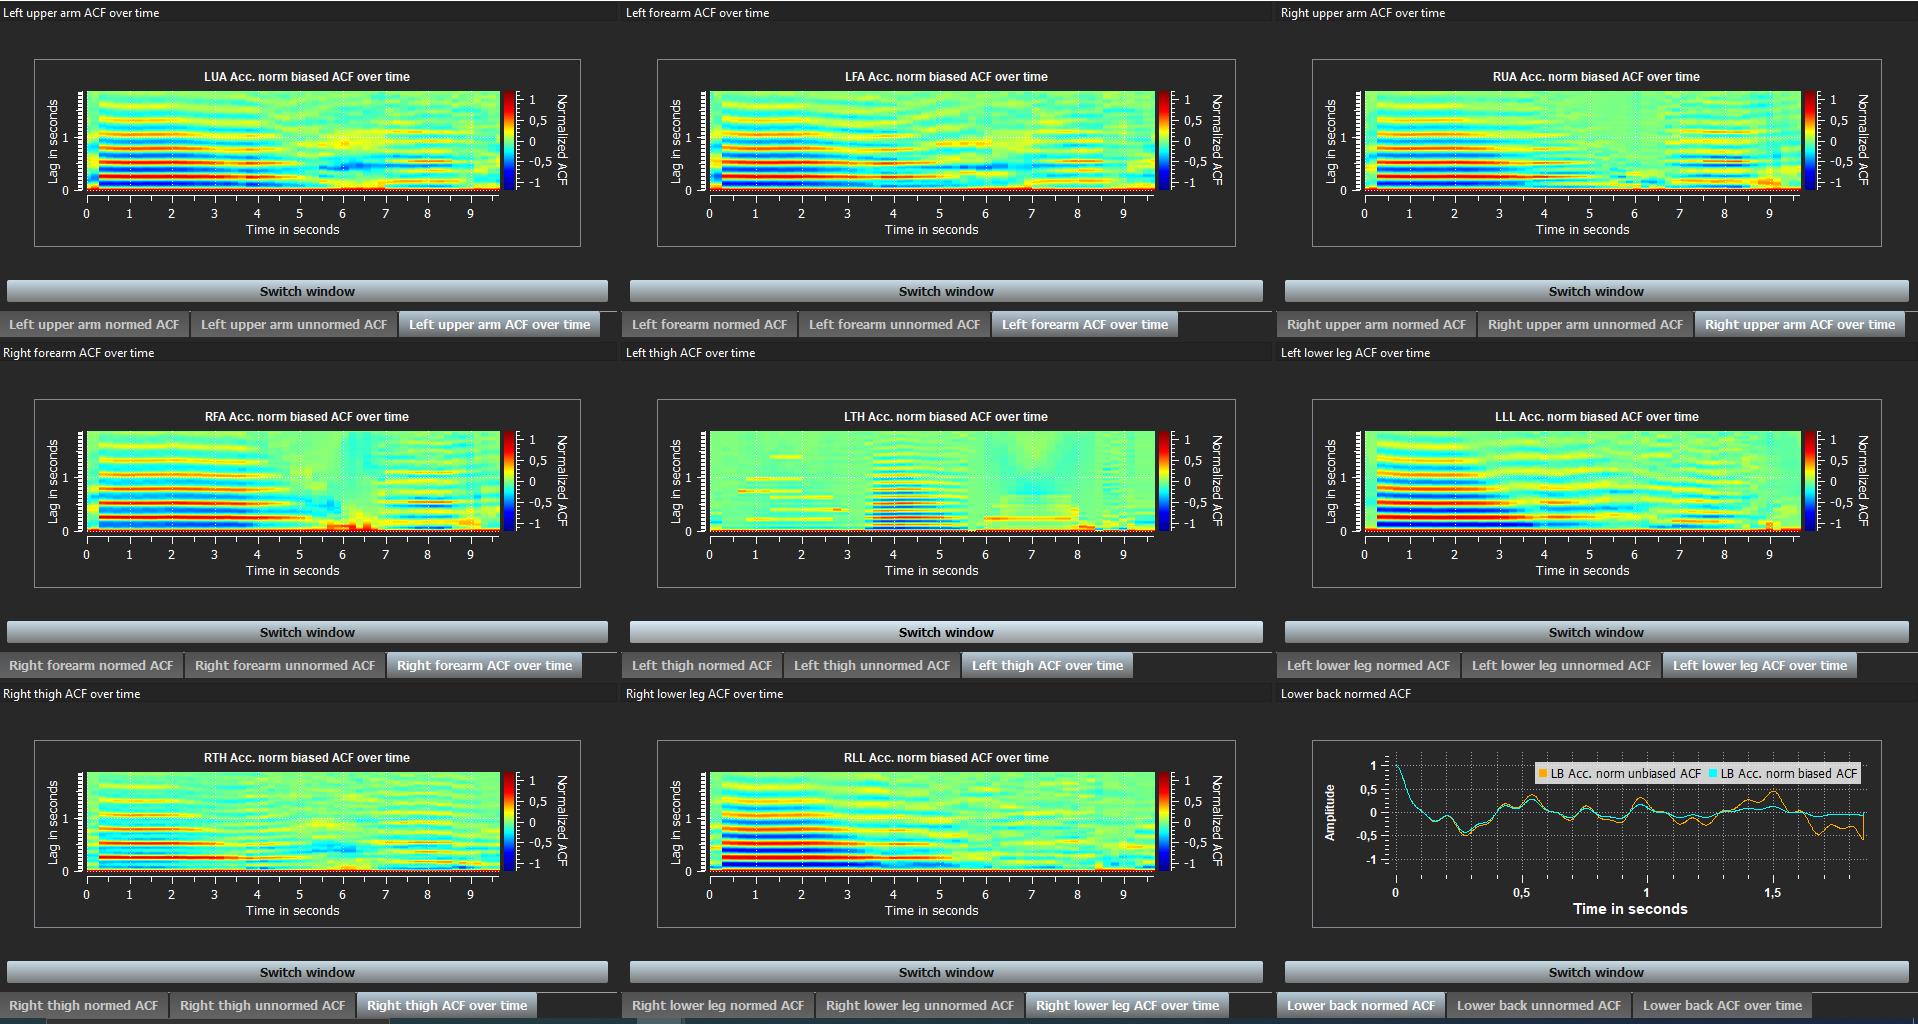
Additional plotter window showing autocorrelations of different sensor packages.
The plotter in the main window shows preprocessed data of the left thigh' accelerometer for the separate axes. This can be used to comprehend the standing up and sitting down motions and their respective influence on the accelerometer. The angle computation takes advantage of these obvious relations. Using the GUI, a variety of other signals can be displayed in this plotter as well.
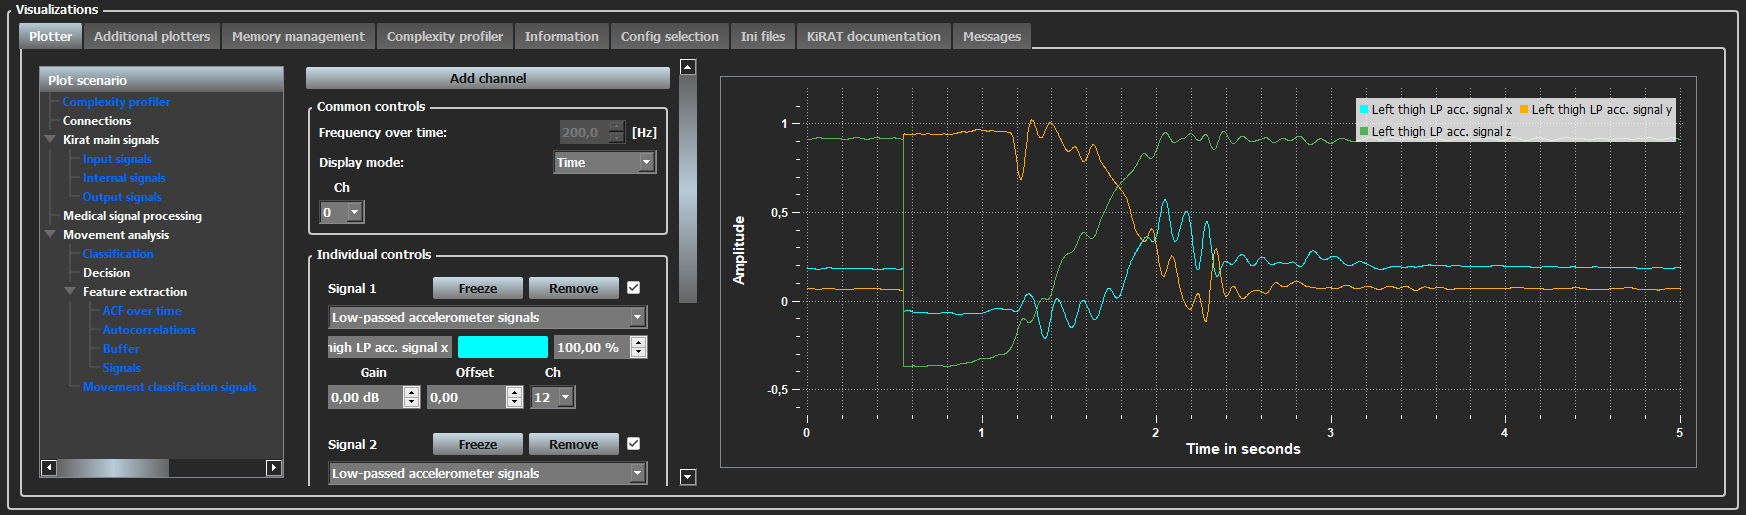
Additional plotter window showing autocorrelations of different sensor packages.
The presented KiRAT setup can be used for real-time analysis of human motion relying only on a few IMUs. In addition to the automatic classification, it presents helpful graphic representations of calculated features and signals to be interpreted by the user.